[update 4/18/2022 - Converting this old post to a new system and it is a blast to see this old code post! I'm leaving this post here but the code has been lost to time...]
I have been working on a small project in my free time for the past couple of weeks -
The short version: I wanted to produce a .net program that would produce ‘in-cell’ visualizations. There are already a number of techniques and programs for doing this (see links below) - many more beautiful and professional than my effort - but I think that a few of the features in this program (at least for me) are unique and useful. The Visual Studio VB.NET solution is available (and I had programmatic use in mind…) as well as a setup for the application (download links below) - BEWARE THIS IS ALPHA SOFTWARE AND MAY BE UNSTABLE AND UNPREDICTABLE. See the screenshots below.
The Long Version: If you work with Excel long enough I think that you will eventually run into a situation where small/mini/’in-cell’ graphs - in the style of/informed/inspired by Edward Tufte’s Sparklines - become very interesting. Mini-graphs are a fantastic way to increase the density of information, I am especially fond of using them to visualize information that would not normally fit onto a single screen.
A Google search Sparklines returns nearly 2 million results - there is a lot to choose from! - I think the links below are exceptionally helpful with Excel and Sparklines in mind:
E.T. Sparklines - Pages from the Sparklines Chapter and a really interesting discussion.
Lightweight Data Exploration and More on Excel in-cell graphing from Juice Analytics: These articles have some awesome examples of lightweight data visualizations in Excel.
Daily Dose of Excel In-Cell Charting: Check out the Charting category for some other interesting ideas.
Mike Schaeffer's Weblog - Excel 12 Databars Now. (Sort Of):Another nice take on in-cell databars via a UDF.Andrew's Excel Tips - Bar Graphs In Cells/2: A different take on autoshapes to produce the graphs - very nice results.
BonaVista Systems MicroCharts: I have only recently tried this - interesting stuff.
Bissantz SparkMaker: Very polished and beautiful with many great options - well worth the time to download and explore.
Particle Tree Sparklines Roundup: Nice set of links grouped by language - this points to some really useful links.
If you follow the links above you will quickly see that there are attractive code and applications already written - but I had some specific goals that I thought might be served by writing this program:
-Shapes based on Excel (Office) shapes rather than a font or an image - I did not expect the results to easily move to an application other than Excel, to scale as well or to be as sharp as a custom font or image, but I wanted a format that would easily and simply coexist with the 'normal' contents of a cell (text/formulas).
-Programmatic Use in .net/Windows Forms - I hope to use this in later projects and I was not sure that the examples I found would integrate nicely into a winforms application with the features I was looking for.
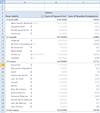
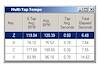
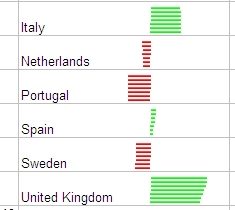
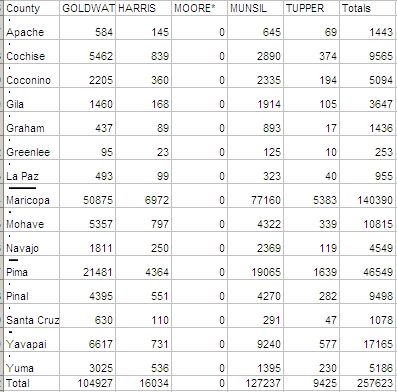
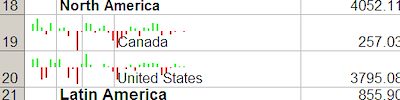
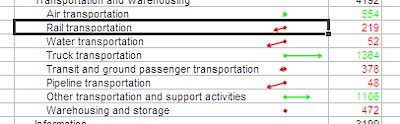
Some samples:
Potential Problems:
-ONLY LIGHTLY TESTED and may contain many severe bugs and possible problems, use at your own risk!!!
-Application needs the .net Excel PIA (there are several potential problems including getting the PIA, installing it and compatibility issues with Excel 2000 and earlier)
-There is currently either a variable type/rounding or resolution limit that creates poor spacing in some combinations of lines - the problem is easy to reproduce but has been lower on my list of things to fix…
-Runs outside of Excel rather than as an add-in - I REALLY like this approach, but it seems to create potential failure points during communication with Excel and can leave an Excel process behind if this application is closed after Excel (not sure best way to catch this)
-A certain lack of code comments and application help or documentation…
Things on my higher up on the current ‘hope to get done’ list - Explore ways to fix the gaps/unevenness in tightly spaced lines Continue to find/fix/trap errors Add grouping to sets of lines Improve documentation
[Update 9/25/2006] I finished a few changes over the weekend, the files linked above are now updated: -Added Grouping UI options and code (need to refine but seems to be stable and working) -Added to UI to attempt to make options slightly more clear -Moved Stats to its own class making databinding the Summary information to the UI possible -Moved code from main form into Collection class for better logic -Provided for a case where a value set has same min and max (which previously crashed with divide by zero error) [Update 9/25/2006]
Comments, Suggestions, Code Fixes and Improvements Very Welcome! CM